[ad_1]
Sample and patient consent
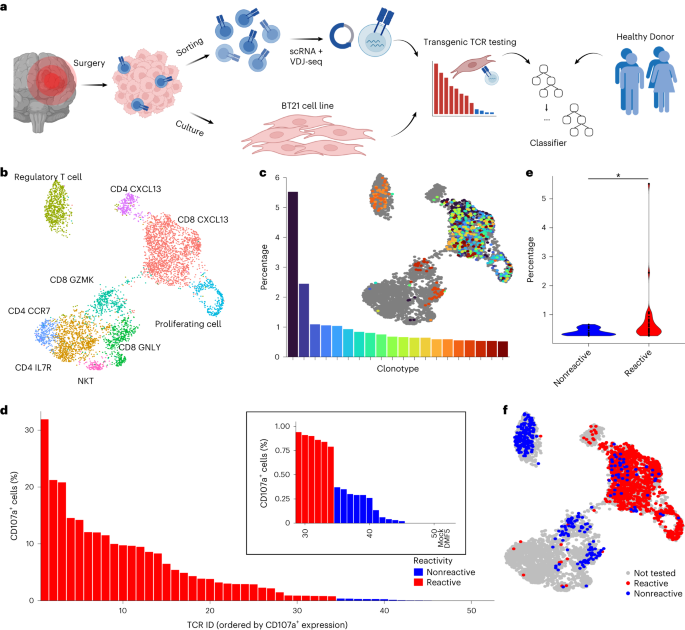
Patient BT21, a 62-year-old male previously diagnosed with melanoma, was treated for a brain metastasis at the University Hospital Mannheim following written consent. The patient was not financially compensated for participation. The study was approved by the institutional review board (Ethikkommission 2019-643N).
Processing of tumor samples for sequencing
Freshly resected brain tumor tissue was obtained from the University Hospital in Mannheim. The patient gave informed written consent before sample collection. Tissue was transported on ice in phosphate-buffered saline (PBS) (Sigma-Aldrich) and processed within 3 h of resection by dissection into into small pieces (2 × 2 × 2 mm). Individual tumor pieces were snap frozen and stored at −80 °C before extracting DNA and RNA for sequencing. The whole-exome library was prepared using SureSelect Human All Exon V7 (5191-4028, Agilent) and the RNA sequencing library was prepared using Ultra Low Input RNA-Seq from TakaraBio. Both were sequenced using NovaSeq 6000 (2× 100 bp). DNA isolated from PBMCs from patient BT21 was included as the whole-exome reference sample.
The remaining tumor pieces were gently mashed through a 100 µm cell strainer using the back side of a syringe plunger to generate a single-cell suspension. To generate a tumor cell line, a portion of the single-cell suspension was spun down (350g, 5 min, room temperature) and resuspended in Dulbecco’s modified Eagle medium/F12 (Gibco) supplemented with 1× penicillin–streptomycin (Sigma), 1× B27 supplement (Thermo Fisher), 20 ng ml−1 epidermal growth factor (236-EG, R&D Systems) and 20 ng ml−1 fibroblast growth factor (13256-029, Thermo Fisher). Cells were placed in a 37 °C CO2 incubator where they started to grow as spheroids. Cells were subsequently transferred into Roswell Park Memorial Institute (RPMI)-1640 media (Sigma) supplemented with penicillin–streptomycin and 10% fetal bovine serum (FBS), whereupon they grew as a monolayer. Cells were split with accutase (A1110501, Thermo Fisher) when appropriate during establishment of the robustly growing tumor cell line.
The remaining single-cell suspension was filtered through a 70 µm cell strainer, myelin was removed using myelin removal beads II (130-096-433, Miltenyi) and LS columns (130-042-401, Miltenyi) according to the manufacturer’s protocol, and aliquots of the single-cell suspension were cryopreserved as described for PBMCs. Thawed aliquots were used for fluorescence-activated cell sorting (FACS)-based enrichment of T cells (CD3+ and CD45+) and prepared for sequencing using Chromium Single Cell V(D)J Reagent kit v1.1 chemistry (PN-1000006, PN-1000020, PN-1000005 and PN-120262, 10X Genomics) according to the manufacturer’s protocol. The constructed scVDJ library and scGEX libraries were sequenced using the NovaSeq 6000 platform (Illumina).
Exome sequence variant calling
Variant calling was performed by the German Cancer Research Center Omics Data Core Facility using previously described pipelines41. Briefly: exome sequencing was performed on DNA extracted from PBMCs, tumor and the tumor cell line. SNVs were called relative to the human genome reference sequence GRCh37, and tumor and cell line SNVs determined by subtracting germline SNVs present in the PBMC sample using the One Touch Pipeline42.
In silico HLA typing from bulk RNA-seq data
For in silico human leukocyte antigen (HLA) typing on paired fastq files from bulk RNA-seq analysis, arcasHLA43 was used to perform in silico HLA typing on paired fastq files from bulk RNA-seq analysis.
Recovery of TCR sequences from bulk RNA-seq data
We used TRUST4 to reconstruct unpaired α and ß TCR chain sequences from within the bulk RNA-seq data as described by Song et al.44.
Generation of TCR in vitro-transcribed mRNA constructs
Cell Ranger-derived TCR clonotype data were processed in R using tidyverse functions45. VDJ regions of TCRs were ordered as synthetic DNA fragments from Twist Biosciences and cloned in 96-well format as chimeric TCRs, using murine TRAC or TRBC constant region sequences that had been further modified to include an additional disulfide bond to improve stability and avoid mismatches with the endogenous human TCR after transduction into human T cells46,47. As negative controls, we cloned two TCRs targeting HLA-A*02:01 restricted epitopes of MART1 (DMF5 TCR: CDR3α CAVNFGGGKLIF and CDR3β CASSLSFGTEAFF) or influenza (CDR3α CAVSESPFGNEKLTF and CDR3β CASSSTGLPYGYTF). For in vitro transcription, RNA-mediated expression TCR constructs were PCR amplified using a primer to add a T7 promoter, and the resulting PCR product used as a template for the T7 mScript Standard mRNA Production System (CELLSCRIPT C-MSC11610). mRNA was m7G capped and enzymatically polyadenylated following the manufacturer’s instructions. For TCR killing assays, TCR constructs were subcloned into S/MAR nanovectors using classical molecular biology techniques as previously described48.
Isolation and expansion of healthy donor PBMCs
PBMCs from healthy donors were isolated from heparinized blood. In short, 15.5 ml of Ficoll Paque Plus Media (Cytiva) was loaded per Leucosep tube (Greiner Bio-One) and spun down. After adding 3 ml of PBS (Sigma), up to 25 ml of blood was loaded on top and a density-gradient centrifugation was performed at 800g (acceleration 4 and deceleration 3). After collection of the interphase, PBMCs were washed twice with PBS and frozen in a controlled rate freezing device at −80 °C in 50% freezing medium A (60% X-Vivo 20 and 40% fetal calf serum) and 50% medium B (80% fetal calf serum and 20% dimethylsulfoxide). Cells were stored in liquid nitrogen at −140 °C until further analysis.
The rapid expansion protocol was used to expand T cells. PBMCs from three independent donors were irradiated at 40 Gy using a Gammacell 1000 (AECL) irradiation device to serve as feeder cells. Then, 1 × 10⁷ cells from each donor were pooled together, cells were spun down (400g, 10 min, room temperature) and resuspended in rapid expansion protocol media (X-Vivo15 (Lonza, BE02-060Q), 2% human AB serum (H4522-100ML, Sigma-Aldrich), 2.5 µg ml−1 Fungizone (15290-018, Gibco), 20 µg ml−1 gentamicin (2475.1, Roth), 100 IU ml−1 penicillin and 100 µg ml−1 streptomycin (15140122, Life Technologies)). Next, 150,000 PBMCs were plated into a standing T25 flask and 666 ng of OKT-3 antibody (Life Technologies, 16-0037-85) was added to the culture and the flask was topped up to a total volume of 20 ml. The next day, 5 ml of X-Vivo15 supplemented with 2% AB serum containing 7,500 IU interleukin-2 (IL-2) was added to the culture. Three days later, 12.5 ml of medium was removed and replaced with 12.5 ml of X-Vivo15 supplemented with 2% AB serum containing 600 IU ml−1 IL-2.
Melan A expression
Melan A expression was confirmed using anti-Melan A-FITC (cat. no. sc-20032, clone A103, Santa Cruz Technology), diluted at 1:10.
TCR reactivity screening via flow cytometry
TCR-encoding RNA was electroporated into expanded healthy donor PBMCs using the Lonza 4D-Nucleofector (program EO-115, solution P3 supplemented according to the manufacturer’s recommendations), which were plated into 48-well plates containing TexMACS media (130-097-196, Miltenyi) supplemented with 2% human AB serum. At 18–24 h after electroporation, cells were collected and 50 IU ml−1 benzonase (YCP1200-50KU, Speed BioSystems) was added to avoid cell clumping. TCR expression levels were measured via flow cytometry with markers including fixable viability dye (AF700, BD), CD3 (clone HIT3A, BV510, BD) and mTCRb (clone H57-597, PE, Biolegend).
To assess TCR reactivity, a total of 150,000 T cells and 75,000 cells of the patient-autologous tumor cell line were cocultured in U-bottom 96-well plates in a total volume of 200 µ. Wells with only T cells, or T cells and TransAct beads (130-111-160, Miltenyi) were used as negative and positive controls, respectively. Then, 5 µl of CD107a FACS antibody (REF 561343, BD) was added per well. After 1 h of coculture, GolgiPlug and GolgiStop (555029 and 554724, BD) were added to reach a 1:1,000 dilution, and after four additional hours of coculture cells were used for flow cytometry analysis. Markers included fixable viability dye (AF700, 1:1,000 dilution, eBioscience), CD3 (clone HIT3A, BV510, 1:20 dilution, BD), mTCRb (clone H57-597, 1:50 dilution, PE, Biolegend) and TNFa (clone MAb11, BV711, 1:10 dilution, Biolegend). Samples were acquired on a FACS Lyric device and flow cytometry data were analyzed using FlowJo software, v10.6.2 (FlowJo LLC).
TCRs were classified as reactive or nonreactive based on flow cytometry data acquired after coculture. The percentage of CD107a positive cells (%CD107a) was quantified by gating on viable CD3+ mTCRβ+ singlets. TCRs were included in the analysis if the mTCRβ expression was >2%.
The %CD107a signal per TCR after coculture with the cell line (‘TCR versus cell line’) or after running the coculture assay without stimulation (‘TCR, unstimulated’) was corrected for background by calculating
$$\begin{array}{l}( \mathrm\% {\mathrm{CD}}107{{\mathrm{a}}}_\mathrm{TCRvscellline}- \mathrm\% {\mathrm{CD}}107{{\mathrm{a}}}_\mathrm{TCR,unstimulated})-\\( \mathrm\% {\mathrm{CD}}107{{\mathrm{a}}}_\mathrm{Mockvscellline}- \mathrm\% {\mathrm{CD}}107{{\mathrm{a}}}_\mathrm{Mock,unstimulated})\end{array}$$
where mock refers to expanded T cells electroporated without TCR-encoding RNA. TCRs were classified as reactive if the background corrected %CD107a signal per TCR was larger than 2× the standard deviation of the %CD107a+ signal measured in all samples without stimulation (1× s.d. of 0.34%). Where a TCR clonotype expressed two α chains, data are presented for the α chain resulting in the %CD107a expression (that is, the functional pair).
TCR reactivity screening via xCELLigence real-time killing assays
Primary human CD3+ cells were isolated from healthy donor volunteers using the Pan T cell isolation kit from Miltenyi Biotec according to the manufacturer’s instructions. The isolated T cells were then activated for 3 days using the human T Cell TransAct kit (Miltenyi Biotec) according to the manufacturer’s instructions and cultured in TexMACS medium from Miltenyi Biotec supplemented with IL-7 and IL-15, both at a final concentration of 10 ng ml−1, at a concentration of 1 × 10⁶ cells ml−1. 3 days post activation 2 × 10⁶ cells were washed and resuspended in 20 μl of primary P3 solution (Lonza), mixed with 2 μg of S/MAR DNA nanovectors and pulsed with the FI-115 pulsing code using the Lonza 4D-Nucleofector.
Primary human T cells were collected, washed two times and resuspended in FACS buffer (PBS containing 1% of FBS). TCR expression was detected by flow cytometry and T cells were stained with a PE-conjugated antibody (clone H57-597, PE, Biolegend) for 30 min on ice in the dark. Dead cells were excluded by 4,6-diamidino-2-phenylindole gating and alive TCR+ cells were gated. Data analysis was performed using FlowJo software.
A real-time killing assay using the xCELLigence was performed. Briefly, BT21 tumor cells were seeded on a 96-well plate (3 × 10⁴ cells per well) and incubated for 24 h. Transgenic T cells were added at an effector–target cell ratio of 2:1 and co-incubated at 37 °C in RPMI 10% medium for 24 h. Cell growth was then monitored for 24 h.
TCR reactivity screening via cell-mediated cytotoxicity
Analysis of transgenic TCR cell cytotoxicity at microfluidic scale was carried out on the VivaCyte platform (Cellply) loaded with a CC-Array microfluidic device based on a modified version of the open-microwell technology49. The CC-Array contains 16 lanes, each lane comprising 1,200 microwells where effector and target cells can interact. Lower microfluidic channels under the microwell array of the CC-Array device were initially preloaded with 6% gelatin methacryloyl hydrogel (900622, Sigma-Aldrich) in PBS and the gel was polymerized with an ultraviolet lamp. BT21 target cells were prestained with CellTracker Blue CMAC Dye (C2110, Thermo Fisher, Invitrogen). Transgenic T cells and BT21 target cells were resuspended in 100% FBS (10270106, Thermo Fisher, Gibco) and loaded on the upper channels of the CC-Array device, resulting in the formation of cocultures on the bottom part of the microwell at the interface between the liquid and the underlying gelatin methacryloyl layer. Each lane was loaded with T cells expressing a single TCR. After cell delivery, a solution of RPMI-1640 (R0883, Sigma-Aldrich) and propidium iodide (P3566, Thermo Fisher) was then delivered into the microchannels and the microfluidic design allowed to rapidly exchange media in the microwells without displacing the cells. The CC-Array device was maintained at 37 °C, 5% CO2 and >90% relative humidity in the VivaCyte instrument for the duration of the assay and fluorescence images were acquired every 2 h for 12 h.
An automated analysis of the images was carried out by the VivaCyte software featuring a pretrained deep learning method50 to detect target cell cytoplasm. Nine hundred microwells were imaged per microchannel by acquiring 20 subarrays per microchannel. Cell viability was quantified as the frequency of cells stained with CMAC and not stained with propidium iodide.
ScRNA-seq analysis
Fastq files from sequenced TIL samples were processed using 10X Genomics’ Cellranger v6.1.2 (ref. 51) and count matrices are imported into R v4.1 (ref. 52). Briefly, SoupX53 was used to removed background noise and miQC54 used to remove poor quality or degraded cells (that can be identified as having an unusually high mitochondrial gene expression). Cells with an ‘RNA count’ <1,200 and ‘Feature count’ <500 were excluded from further analysis.
Healthy PBMC datasets
PBMC datasets enriched with T cells from healthy donors were obtained as follows: a single healthy donor PBMC sample from 10X Genomics55, two donors from Szabo et al.56 and seven donors from Gao et al.57. In total, data from 111,499 T cells were obtained.
PredicTCR classifier training
All scRNA count data from both internally and externally generated datasets were normalized using the ‘sctransform’ method as implemented in Seurat v4 (ref. 58), resulting in a gene–cell matrix of Pearson residuals that was used as the model input. TCR reactivity was converted to a binary value from the CD107a flow cytometric quantification as described above; all healthy donor PBMCs were assumed to be nonreactive. The model was trained using scRNA + VDJ-seq data from healthy donors (111,499 cells) plus data from experimentally validated BT21 derived TCRs for predicTCR50 (1,461 cells) or predicTCR (1,679 cells) as appropriate. Data were imported in Python (v3.9.16) using pandas (v2.0.2) for preprocessing before training with xgboost (v1.7.4). Due to the scRNA data having many dropouts, we performed hyperparameter tuning before feature selection. The XGBoost hyperparameters ‘colsample_bytree’, ‘gamma’, ‘learning_rate’, ‘max_delta_step’, ‘max_depth’, ‘min_child_weight’, ‘n_estimators’, ‘alpha’, ‘lambda’, ‘scale_pos_weight’ and ‘subsample’ were tuned by Bayesian optimization using scikit-optimize (v0.9.0)59 with ten stratified k-fold cross-validations to generate an intermediate classifier model. Due to the imbalanced nature of the training dataset, particular attention was put on optimizing data weighting (‘scale_pos_weight’). We used 70% of the data as training data, and the remaining 30% as testing dataset for hyperparameter training. To prevent overfitting to the BT21 training data, we simplified the intermediate classifier using SHAP27 to identify the key genes contributing to the model. The final predicTCR classifier was then trained on the top 100 SHAP features and hyperparameters were again optimized as before.
Prediction of tumor-reactive T cells using predicTCR
External datasets used to validate predicTCR were downloaded and the raw data preprocessed as described above. The prediction probability for each cell was averaged for each clonotype and the subsequent prediction probability for each clonotype was used to calculate the AUC using pROC. The threshold used to classify TCR reactivity was determined using Fisher–Jenk natural break optimization as implemented in jenkspy. The confusion matrix and accuracy of the resulting prediction were then calculated using caret (v6.0-94), and G-mean (the square root of sensitivity and specificity) was calculated using the output of caret.
Prediction of tumor-reactive T cells using the NeoTCR8 gene signature
Predictions using the NeoTCR8 gene signature were performed as described in Lowery et al. Briefly, the raw gene count matrix was imported into R and scGSEA (using GSVA package, v1.46.0) was performed using the signature gene list (NeoTCR8) obtained from Lowery et al.23. Cluster(s) that correspond to 0.95 percentile expression were designated as reactive. A reactive score was calculated using the ratio of predicted reactive cell to the total number of cells for each clonotype. The AUC was then calculated based on this probability score using pROC. To make direct comparisons with the performance of predicTCR, we applied the same Fisher–Jenk optimization to determine the threshold for distinguishing between reactive and nonreactive TCR clonotypes on the basis of the reactive score.
Prediction of tumor-reactive T cells using the Hanada et al. gene signature
Signature analysis using the Hanada et al. gene signature was performed as described in Hanada et al. Briefly, the raw gene count matrix was imported into R and the score was calculated by adding the genes that contributed positively to the signature and minus the genes that contributed negatively to the signature. Cells that were positive for the signature were called as (neoantigen) reactive. A reactive score was calculated and a minimum threshold for tumor reactivity was determined using Fisher–Jenk optimization as described above.
Prediction of tumor-reactive T cells using the Caushi et al. gene signature
Signature analysis using the Caushi et al. gene signature was performed similarly to Caushi et al. Briefly, the raw gene count was imported into R and analyzed using Seurat. Seurat was used to normalize the raw count data, then using ‘AddModuleScore’, a signature score was calculated using the mutation-associated neoantigen functional expansion genes. Cells that were positive for the signature were called as reactive. A reactive score was calculated and a minimum threshold for tumor reactivity was determined using Fisher–Jenk optimization as described above.
Prediction of tumor-reactive T cells using the Meng et al. TR30 gene signature
Signature analysis using Meng TR30 gene signature was performed as described Meng et al.22. Briefly, the raw gene count was imported into R and analyzed using Seurat. Seurat was used to normalize the raw count data; then the TR30 signature was computed using the UCell package (v2.2)60. The mean of the TR30 signature score was then calculated for each TCR clonotype and termed the Meng TR30 score. The minimum threshold for tumor reactivity was similarly determined using Fisher–Jenk optimization.
Material availability
The use of the primary tumor cell lines specified in this manuscript is restricted by patient informed consent and institutional review board approval to this study.
Reporting summary
Further information on research design is available in the Nature Portfolio Reporting Summary linked to this article.
Maqvi News #Maqvi #Maqvinews #Maqvi_news #Maqvi#News #info@maqvi.com
[ad_2]
Source link


