


[ad_1]
Base editing leads to imprecise outcomes at target sites ascribed to DNA DSBs
To compare different editors side by side, we selected a state-of-the-art version of a CBE (BE4max)27 and an ABE (ABE8.20-m)20 and used a gRNA targeting the gene encoding β2-microglobulin (β2M)20 that can be coupled with either a BE or Cas9 to induce its knockout (KO). Because β2M is ubiquitously expressed on the cell surface, its KO allows straightforward quantification of editing efficiency by measuring lack of β2M expression via flow cytometry. Specifically, to induce B2M KO, Cas9 and BE4max introduce indels or a premature stop codon, respectively, while ABE8.20-m disrupts a splicing donor site (Fig. 1a). B2M editing by BE4max and ABE8.20-m in a B lymphoblastoid cell line reached around 60% B2M KO after electroporation of in vitro transcribed mRNAs in a dose-dependent manner (Fig. 1b,c and Extended Data Fig. 1a,b). As expected, B2M KO was not detected after BE combination with an unrelated gRNA. Flow cytometry and molecular analysis of single-cell-derived clones revealed that only biallelic KO reduced β2M expression on the cell surface (Fig. 1d). In human primary T cells, BE4max and Cas9 resulted in 80–90% B2M-KO cells, while ABE8.20-m reached >95% (Fig. 1e). All editing treatments showed comparable acute toxicity, mostly ascribed to electroporation (Fig. 1f and Extended Data Fig. 1c,d). In cord blood (CB)- and mobilized peripheral blood (mPB)-derived CD34+ HSPCs, we investigated different timings for gene editing and compared 1 versus 3 d of culture after thawing (Fig. 1g). Whereas a longer protocol promotes metabolic activation and cell cycle progression, a shorter protocol may better preserve stem cell phenotypic markers. B2M KO was highly efficient for all systems, with ABE8.20-m outperforming BE4max and Cas9 (reaching up to 88, 63 and 64%, respectively, at the highest dose; Fig. 1h and Extended Data Fig. 1e,f), without detectable changes in the proportion of different progenitor subsets (Fig. 1i and Extended Data Fig. 1g). KO was lower at day 1 than at day 3, in particular for BE4max, Cas9 and the most primitive progenitor subset (Fig. 1h and Extended Data Fig. 1f). HSPCs treated with BE4max and ABE8.20-m showed similar in vitro clonogenic potential as mock-electroporated cells and higher clonogenic potential than Cas9-treated cells, pointing to a milder impact of BEs than Cas9 on HSPC function (Fig. 1j).
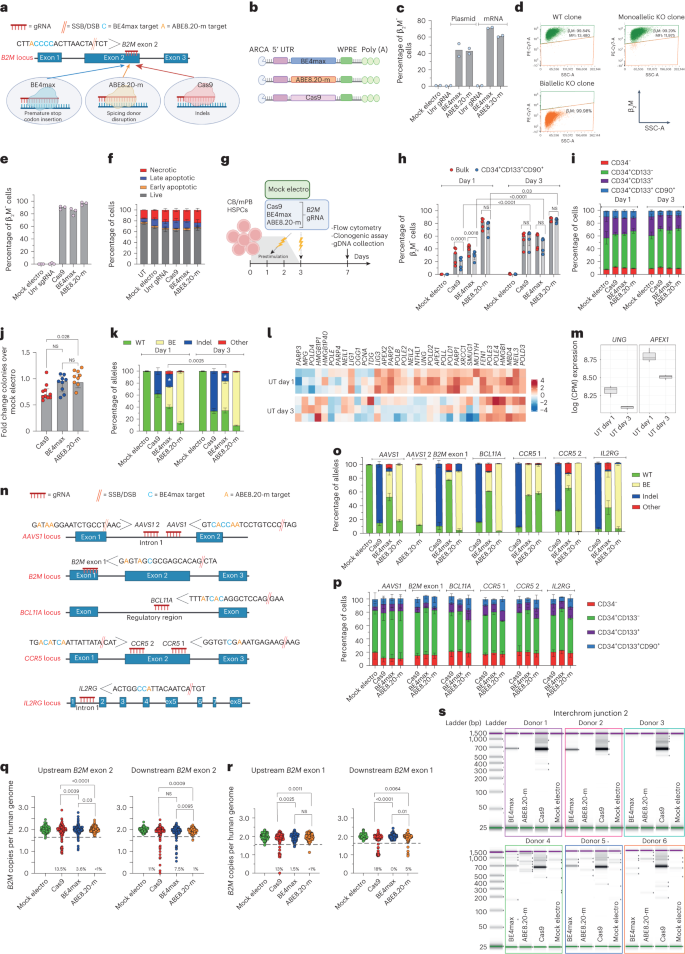
a,b, Schematic representation of the B2M exon 2 editing strategies and their cognate genetic outcomes (a) and the editor mRNAs (b); ARCA, anti-reverse cap analog; WPRE, woodchuck hepatitis virus post-transcriptional regulatory element. c, Percentage of β2M− B lymphoblastoid cells as measured by flow cytometry (n = 2). Data are shown as median values; Unr, unrelated; Mock electro, mock electroporated. d, Flow cytometry plots of three representative B lymphoblastoid clones showing wild-type (WT), monoallelic and biallelic editing confirmed by Sanger sequencing; SSC-A, side scatter; MFI, mean fluorescence intensity. e, Percentage of β2M− human T cells 7 d after treatments (n = 3). Data are shown as median values. f, Percentage of live, early/late apoptotic and necrotic T cells 24 h after treatments; UT, untreated (n = 3). Data are shown as mean ± s.e.m. g, Experimental workflow for B2M editing in CB or mPB HSPCs. h, Percentage of β2M− CB HSPCs edited at day 1 or day 3 after thawing (n = 5). Data are shown as median values with interquartile range (IQR) and were analyzed by a linear mixed effects (LME) model followed by post hoc analysis; NS, not significant. i, Proportion of cellular subpopulations within CB HSPCs from experiments in h (n = 5). Data are shown as mean ± s.e.m. and were analyzed by an LME model followed by post hoc analysis. j, Fold change in the number of colonies generated by CB or mPB HPSCs over mock electroporation (n = 10). Data are shown as median values with IQR and were analyzed by Kruskal–Wallis test with Dunn’s multiple comparison test. k, Percentage of B2M alleles measured by deep sequencing (WT or carrying the described editing outcomes in CB HSPCs; n = 5 for day 1; n = 6, 7, 7 and 7 for day 3). Data are shown as mean ± s.e.m. and were analyzed by Mann–Whitney test. Statistics is denoted by asterisks. l, Heat map of normalized read counts for genes belonging to the BER pathway (KEGG database hsa03410) in untreated CB HSPCs cultured for 1 or 3 d (n = 3). m, UNG and APEX1 log counts per million (CPM) reads in untreated CB HSPCs cultured for 1 or 3 d (n = 3). The center of the box plot represents the median, and boundaries represent first and third quartiles. Upper and lower whiskers extend 1.5× IQR from the hinge. n, Schematic representation of the AAVS1, B2M exon 1, BCL11A, CCR5 and IL2RG editing strategies. o, Percentage of AAVS1, B2M exon 1, BCL11A, CCR5 and IL2RG alleles measured by deep sequencing (WT or carrying the described editing outcomes in mPB HSPCs; n = 3 for AAVS1 Cas9; n = 7 for AAVS1 BE4max and ABE8.20-m; n = 3 for B2M exon 1, BCL11A, CCR5 and IL2RG). Data are shown as mean ± s.e.m. p, Proportion of cellular subpopulations within mPB HSPCs from experiments in o (n = 3). Data are shown as mean ± s.e.m. Samples edited in BCL11A, CCR5 and IL2RG were unified for statistical analysis using a Friedman test with Dunn’s multiple comparison on the most primitive compartments (CD34+CD133+ and CD34+CD133+CD90+), as experiments were performed in parallel on the same mPB HSPC donors. Cas9 and BE4max showed a significant reduction in the proportion of primitive compartments compared to ABE8.20-m (P = 0.016 and P < 0.0001, respectively). q, Copies of B2M sequences per human genome flanking the exon 2 target site in individual colonies generated by edited mPB HSPCs (n = 105, 188, 188 and 187 for the ‘upstream’ assay; n = 93, 188, 188 and 187 for the ‘downstream’ assay). Dashed lines indicate the lower limit of the confidence interval from mock-electroporated colonies. Data are shown as median values and were analyzed by Fisher’s exact test. r, Copies of B2M sequences per human genome flanking the exon 1 target site in individual colonies generated by edited mPB HSPCs (n = 89, 129, 130 and 125 for the ‘upstream’ assay; n = 89, 129, 129 and 126 for the ‘downstream’ assay). Dashed lines indicate the lower limit of the confidence interval from mock-electroporated colonies. Data are shown as median values and were analyzed by Fisher’s exact test. s, Images of capillary electropherograms showing amplification of interchromosomal (interchrom) junction 2 shown in Extended Data Fig. 1l after HSPC editing with two gRNAs targeting B2M exon 2 and AAVS1 in six mPB donors. All statistical tests are two tailed. n indicates biologically independent experiments except for q and r, in which n indicates independent samples.
We then sequenced the B2M target site from the edited cells from Fig. 1h and Extended Data Fig. 1f and found the expected transitions at one or more target bases within the editing window in a proportion of alleles consistent with the fraction of biallelic KO reported above (Fig. 1k and Extended Data Fig. 1h). However, while nearly all ABE8.20-m-edited alleles showed base transitions, more than one-third of BE4max-edited alleles carried indels at the target site. Whereas Cas9-induced indels spanned around the expected DNA DSB site, BE4max indels mostly occurred between the expected nCas9 and BE target sites (Extended Data Fig. 1i). The fraction of indel-bearing alleles was higher for BE4max editing at day 1 than at day 3, when expression of several BER genes, such as APEX1 and the upstream sensor UNG, was also higher (Fig. 1l,m). These findings suggest that excess indels induced by BE4max editing might be due to insufficient UG inhibition by the UGI domain16 and the combined action of the BER-dependent APEX1 endonuclease and nCas9 to generate a DSB at the target sequence. Of note, some SNVs other than the expected transitions (‘Other’ in Fig. 1k and Extended Data Fig. 1h) were also found at the target locus for both BEs, as also reported in other studies of CBEs19,28, suggesting occasional and/or supplemental engagement of alternative repair pathways.
To provide a broader representation of target sequence composition, including for the number and position of editable bases, additional gRNAs targeting the genomic safe harbor adeno-associated virus site 1 (AAVS1), exon 1 of B2M and the therapeutically relevant BCL11A erythroid-specific enhancer, CCR5 and IL2RG were selected (Fig. 1n). At nearly all tested loci, ABE8.20-m outperformed BE4max in terms of efficiency and precision at the target site (Fig. 1o). While indels and other unexpected SNVs were relatively frequent and more common for BE4max, some indels were also retrieved for ABE8.20-m, in particular when targeting exon 1 of B2M. The higher occurrence of indels at the B2M exon 1 site allowed to describe the deletions profile of ABE8.20-m and revealed a distribution centered on the gRNA cut site, similar to Cas9, implying a different mechanism from that postulated above for BE4max and likely due to conversion from an SSB to a DSB after DNA replication (Extended Data Fig. 1j). Consistent with the lower proportions of indels, the fraction of primitive HSPCs was not affected by ABE8.20-m treatment, while it was significantly decreased after BE4max and Cas9 treatment (Fig. 1p).
Overall, these data show that highly efficient base editing allows for the emergence of imprecise outcomes at the target sites, comprising the marks of repaired DSBs. These events are exacerbated in the case of BE4max by its interaction with the BER pathway.
Base editing does not abrogate large deletions and translocations at target sites
To more comprehensively evaluate the spectrum of genetic outcomes at target sites of different editing systems, we screened ∼300 randomly picked colonies from the outgrowth of BE4max-, ABE8.20-m- and Cas9-treated mPB-derived HSPCs for the occurrence of large deletions extending upstream or downstream of B2M exon 2 or 1 gRNA target sites (Extended Data Fig. 1h). For B2M exon 2 targeting, we found mono- or, less frequently, biallelic loss of the interrogated locus in ∼12% of Cas9 colonies and ∼5% of BE4max colonies but only rarely in ABE8.20-m colonies (Fig. 1q). Of note, a higher proportion of deletions was found when probing downstream of the BE4max cut site, in line with the skewed indels pattern (Extended Data Fig. 1i). For B2M exon 1 targeting, we found ∼15% of Cas9 colonies and ∼3% of ABE8.20-m colonies but only rarely in BE4max colonies, where the ABE8.20-m data are consistent with a high proportion of indels at this site, and the BE4max data reflect a low editing efficiency (Fig. 1r and see also Fig. 1o).
We then probed for the possible occurrence of translocations between multiplex editing sites on different chromosomes by co-delivering two gRNAs targeting AAVS1 and B2M exon 2 together with each editing system and amplifying interchromosomal junctions by a matrix of PCR primers binding to each side of both editing loci (Extended Data Fig. 1l). As expected from the high rate of indels and large deletions, Cas9-treated samples were positive for all four possible translocation events between the two sites (Fig. 1s and Extended Data Fig. 1m–o). Notably, translocations were also clearly detectable for BE4max samples in four of six tested donors and for two of the four possible interchromosomal junctions, but not for ABE8.20-m. Sanger sequencing of B2M–AAVS1 junctions revealed that although Cas9 translocations originated precisely from the respective cut sites, BE4max translocations were more heterogenous and spanned from the predicted nCas or APEX1 nicking sites on either side of the junction (Extended Data Fig. 1p).
Overall, these results highlight the occurrence of potentially genotoxic outcomes at BE target sites consequent to DNA DSBs, such as large (greater than or equal to hundreds of base pairs (bp)) deletions and translocations, at rates lower than observed for Cas9 and consistent with the fraction of indels detected by targeted deep sequencing.
BEs trigger p53 activation and interferon response in HSPCs
We then investigated the cellular transcriptome 24 h after treatment with the different editors to identify detrimental responses that may impact HSPC function (Fig. 2a). Besides positive enrichment for genes belonging to apoptosis and inflammation categories in all samples due to electroporation per se, BE4max and Cas9 triggered p53 pathway activation (Fig. 2b,c), with upregulation of nearly identical sets of genes, pointing toward sensing and repair of DNA DSBs as the common trigger (Fig. 2d). The p53 response was lower for BE4max than for Cas9, consistent with the above findings for indels and large deletions at the editing site, but still raising concern for a detrimental impact on HSPC function. In addition, BE4max and ABE8.20-m, but not Cas9, activated interferon alpha (IFNα) and IFNγ responses (Fig. 2c). Unbiased clustering of IFNα and IFNγ target genes revealed upregulated subsets after BE treatments enriched for RNA recognition ontologies, possibly indicating innate cellular sensing of long mRNAs (∼6 kilobases; Fig. 2e–g).
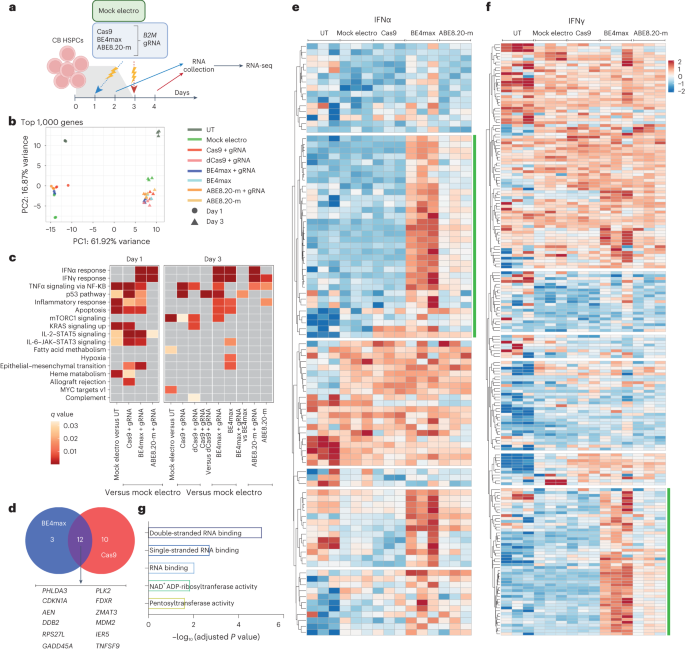
a, Experimental workflow for B2M exon 2 editing in a pool of six CB HSPC donors for transcriptomic analysis (n = 3 technical replicates for each condition). b, Principal component (PC) analysis from the RNA-seq dataset in a. c, Heat map of q values of enriched categories for selected comparisons between treatments on upregulated genes (false discovery rate (FDR) < 0.05 and log (fold change) > 0); dCas9, catalytically inactive (dead) Cas9. Data were analyzed by enrichment test. d, Venn diagram representing the number of p53 target genes upregulated after BE4max or Cas9 treatment. e,f, Heat maps of normalized read counts for target genes belonging to IFNα (e) and IFNγ (f) response categories across samples. Green lines indicate the subset of genes identified by unsupervised clustering with higher normalized read counts after BE treatments. g, Adjusted P values for the top five enriched categories (Hallmark gene set) when computing genes belonging to the green cluster from e and f. Data were analyzed by enrichment test. All statistical tests are two tailed. n indicates the number of independent samples.
BE4max, but not ABE8.20-m, impairs long-term engraftment of edited HSPCs
To investigate editing of the small fraction of repopulating HSPCs comprised within CD34+ cells, we transplanted immunodeficient mice with the outgrowth of matched numbers of cells seeded in culture (day 0) and treated for B2M exon 2 editing by the different systems at day 1 or 3 (Fig. 3a and Extended Data Fig. 2a). Longitudinal PB sampling and bone marrow (BM) and spleen (SPL) analyses at the end of the experiments showed long-term engraftment and multilineage reconstitution by human cells in xenotransplanted mice for all edited samples (Fig. 3b and Extended Data Fig. 2b–d). Engraftment at 9–12 weeks was higher for day 3- than for day 1-treated cells, likely due to an expanded number of short-term repopulating cells in the longer culture. Across multiple experiments, the graft size was significantly lower (P = 0.0075) for Cas9-edited samples than for mock-electroporated samples throughout the follow-up, likely due to the higher DNA DSB load and p53 activation induced by the nuclease5, while the base-edited samples were significantly lower than mock-electroporated samples only at the end of the study (P = 0.049 and P = 0.007, respectively; Supplementary Fig. 1a). When monitoring the edited cell fraction by the proportion of B2M-KO cells in the graft, ABE8.20-m maintained the very high levels of editing achieved in culture in vivo, which were stable in the long-term graft, similar to Cas9-edited cells, which, however, remained at lower levels (Fig. 3c,d and Supplementary Fig. 1b). By contrast, BE4max-edited cells showed a much lower level of editing than the in vitro results and further decreased over time in the graft, in line with a detrimental impact of the editor and/or a lower editing efficiency in long-term repopulating HSPCs (Fig. 3c,d and Supplementary Fig. 1b; interaction term at time 15 weeks, P < 0.0001). Deep-sequencing analysis of the B2M exon 2 target site in human cells retrieved from the mice showed nearly exhaustive occurrence of the expected transitions for the ABE8.20-m samples and a lower proportion consistent with the fraction of engrafted B2M-KO cells for the BE4max samples (Fig. 3e). Indels accounted for most of the editing in Cas9-engrafted cells (Extended Data Fig. 2e) but also contributed considerably in the BE4max samples, where they were more abundant in cells edited at day 1 and decreased from early to late timepoints (Fig. 3e). The latter observation might correlate with higher BER gene expression in day 1-cultured cells and in multipotent or lineage-committed progenitors than in primitive HSCs, as reported by some of us in a single-cell RNA-sequencing (RNA-seq) analysis of CD34+CD133+ CB cells cultured for 4 d (ref. 5; Fig. 3f and Extended Data Fig. 2f). The frequency of indels was lower, but indels were still present, in ABE8.20-m samples, averaging 1–2%. Similar findings in terms of engraftment and editing efficiency were obtained when transplanting HSPCs derived from mPB and edited with all systems either at B2M exon 2 (Extended Data Fig. 2g,h) or AAVS1 (Fig. 3g,h and Extended Data Fig. 2i–l).
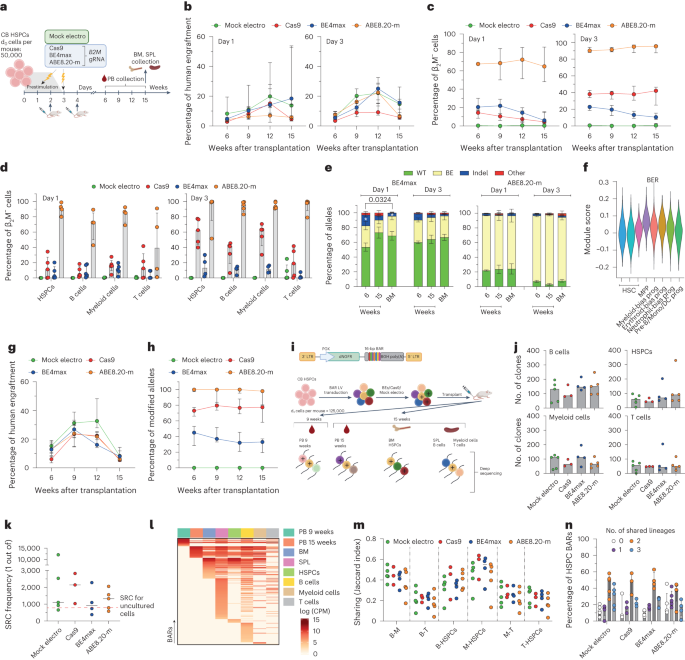
a, Experimental workflow for B2M exon 2 editing in CB HSPCs and xenotransplantation. b,c, Percentage of human cell engraftment (b) and β2M− cells within human grafts (c) in mice transplanted with CB HSPCs after B2M exon 2 editing at day 1 (left; n = 5, 5, 5 and 4) or day 3 (right; n = 5, 5, 4 and 5) after thawing. Data are shown as median values with IQR and were analyzed by LME model followed by post hoc analysis. d, Percentage of β2M− cells within hematopoietic lineages from BM (HSPCs) and SPL (B cells, myeloid cells and T cells) from a (n = 5, 5, 5 and 4 for day 1; n = 5, 5, 4 and 5 for day 3). Data are shown as median with IQR. e, Percentage of B2M exon 2 alleles measured by deep sequencing (WT or carrying the described editing outcomes in mice from a; BE4max n = 5 for day 1, n = 4 for day 3; ABE8.20-m n = 4 day 1, n = 5 for day 3). Data are shown as mean ± s.e.m. and were analyzed by Kruskal–Wallis with Dunn’s multiple comparison. f, Module score for genes belonging to the BER pathway (KEGG database hsa03410) in different HSPC subsets from Schiroli et al.5; MPP, multipotent progenitors; prog, progenitors; Mono, monocyte; DC, dendritic cell; Pre-B, pre-B cell. g,h, Percentage of human cell engraftment (g) and modified AAVS1 alleles within human grafts (h) in mice transplanted with mPB HSPCs after AAVS1 editing at day 3 after thawing (n = 4, 4, 5 and 5). Data are shown as median with IQR and were analyzed by LME model followed by post hoc analysis. i, Schematic representation of the barcoded LV library (top) and the workflow for the CB HSPC clonal tracking experiment (bottom); LTR, long-terminal repeat; PGK, phosphoglycerate kinase promoter; BGH, bovine growth hormone polyadenylation signal. ‘+’ is used to graphically mark edited cells. j, Number of clones in hematopoietic lineages from mouse organs from i (n = 5, 3, 4 and 5). Data are shown as median values. k, Severe combined immunodeficient (SCID)-repopulating cell (SRC) frequency in mice from i, calculated by dividing the d0 equivalent cell number by the number of engrafted clones from BM in Extended Data Fig. 2p. The red line shows the SRCs for uncultured HSPCs29 (n = 5, 3, 4 and 5). Data are shown as median values. l, Heat map of the abundance (red-scaled palette) of BARs (rows) for one representative BE4max mouse in PB at the indicated times after transplant, hematopoietic organs and lineages (columns). m, Jaccard index as a measure of BAR sharing between B cells and myeloid cells (B-M); B and T cells (B-T); B cells and HSPCs (B-HSPCs); myeloid cells and HSPCs (M-HSPCs); myeloid and T cells (M-T); T cells and HSPCs (T-HSPCs) (n = 5, 3, 4 and 5). Data are shown as median values. n, Percentage of unique HSPC BARs shared with 0, 1, 2 or 3 hematopoietic lineages (n = 5, 3, 4 and 5). Data are shown as median values with IQR. All statistical tests are two tailed. n indicates independent animals.
To investigate more stringently whether base editing could affect the output of single HSPC clones, we tracked cells treated with BEs or Cas9 at the clonal level. Because it is hardly possible to couple BEs to a unique genetic identifier, we transduced HSPCs with a lentiviral vector (LV) carrying a reporter (truncated low-affinity nerve growth factor receptor; dNGFR) and a degenerated barcode sequence (BAR) before editing and xenotransplantation (Fig. 3i and Extended Data Fig. 2m). While this strategy cannot discriminate between edited and non-edited cells in the graft, we reached high proportions of B2M-KO cells in vivo for the ABE8.20-m samples, which were virtually all edited (Extended Data Fig. 2n,o). Thus, an altered behavior of ABE8.20-m-edited cells should be easily captured by interrogating the whole graft, while this may not apply to BE4max-treated cells. Although Cas9 treatment led to a moderate shrinkage of clonal complexity in the hematopoietic organs and in most of the sorted hematopoietic lineages, consistent with the lower graft size, ABE8.20-m-edited cells (and BE4max-edited cells) did not show reduced clonality compared to mock-electroporated control cells (Fig. 3j and Extended Data Fig. 2p). Because 100–150 repopulating clones were retrieved from base-edited and mock-treated samples, we calculated a frequency of 1 of 1.0 × 10³–1.5 × 10³ transplanted cells (Fig. 3k), which is in the range of previously reported findings from limiting dilution transplant of uncultured CB-derived HSPCs29. Longitudinal analysis of PB revealed the progressive disappearance of some short-term engrafting clones and the emergence of long-term engrafting clones independent of the treatment, in line with previous observations on HDR-edited xenografts6 and individuals treated with gene therapy30 (Fig. 3l and Supplementary Fig. 2). Most BARs were shared across the different lineages of the same mouse (Fig. 3m,n and Extended Data Fig. 2q,r).
Overall, these findings show that ABE8.20-m efficiently edits and preserves multilineage output of long-term repopulating HSPCs, while BE4max is less efficient and adversely impacts repopulation by edited cells.
Transcriptome and exome analyses uncover global effects of BEs on the mutational landscape
Next, we evaluated the mutational burden induced by BEs at both transcriptomic and genomic levels. We found a consistent, albeit moderate, increase in mutational load on the transcriptomes of HSPCs edited at day 1 or day 3 by ABE8.20-m compared to all other treatments despite similar levels of editor expression (Fig. 4a). The increase applied to all SNV types and not only to the expected A>G transition (Fig. 4b).
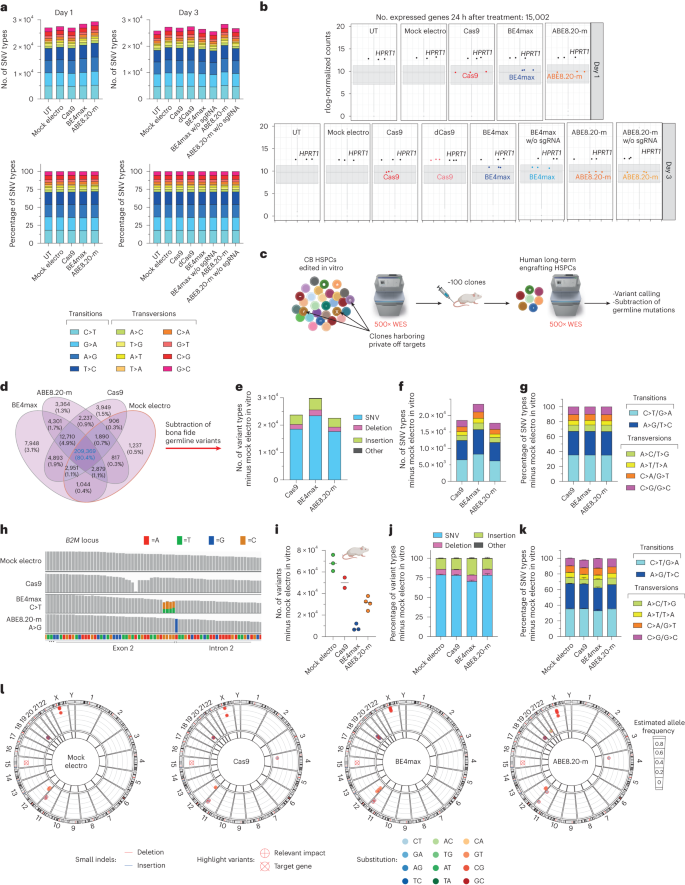
a, Number of SNV types (top) and their relative proportions (bottom) in RNA-seq experiments in Fig. 2a; w/o, without; sgRNA, single gRNA. b, Box plot showing the normalized expression (read counts) of the different editors and the HPRT1 housekeeping gene in RNA-seq experiments in Fig. 2a; rlog, regularized log. c, Schematic representation of the WES rationale and bioinformatic pipeline in CB HSPCs treated in vitro and retrieved from xenotransplanted mice in Fig. 3i. d, Venn diagrams representing variants shared among in vitro treated samples from e. e–g, Number of variants (e), number of SNV types (f) and their relative proportion (g) from in vitro samples from c obtained after subtraction of germline variants. h, Read alignments at B2M in the WES dataset from c. i–k, Number of variants (median; i), relative proportion of variants (mean ± s.e.m; j) and relative proportion of SNV types (mean ± s.e.m.; k) in the human xenograft from c obtained after subtraction of germline variants (n = 3, 2, 3 and 4). l, Circos plots representing variants in cancer-associated genes classified as high/moderate impact identified by WES in the human xenografts from c (n = 3, 2, 3 and 4). All statistical tests are two tailed. n indicates the number of independent samples for Fig. 1a,b and independent animals for i–l.
We then explored the possible occurrence of gRNA-independent genome-wide DNA mutagenesis by the constitutively active, but transiently expressed, deamination domain of the tested BEs on chromatin R-loops. We performed ultrahigh coverage (500×) whole-exome sequencing (WES) of the in vitro outgrowth of HSPCs treated with the different editors from the experiment described in Fig. 3i, calling all variants against the reference human genome (GRCh38) and plotting their intersections among all samples (Fig. 4c,d). As expected, the vast majority of variants were shared by all samples, reflecting germline variants of the HSPC donors. We then subtracted all variants shared between mock-electroporated samples and ≥1 sample from each condition to capture treatment-associated variants and found that BE4max treatment increased their total amounts, but not the relative proportions of different SNVs, compared to Cas9 or ABE8.20-m treatment (Fig. 4e–g). We then postulated that analyzing the expanded clonal outgrowths contributing to the oligoclonal human hematopoietic graft of transplanted mice might increase the sensitivity of analysis toward detection of non-recurring genome-wide variants acquired by individual long-term repopulating cells during the treatment, albeit at the cost of limited sampling (Fig. 4c). The expected C>T or A>G transitions were highly represented at the B2M target locus in all BE4max and ABE8.20-m samples, respectively, thus validating our pipeline (Fig. 4h). Similarly, for Cas9 samples, we retrieved substantial proportions of indels in the target region, reflected by drops in read alignment. For the genome-wide analysis, as before, we subtracted all variants previously called for the mock-electroporated samples in the in vitro analysis (Fig. 4d) and computed those specific for each mouse/HSPC treatment. Remarkably, we found the lowest figures for BE4max samples, followed by ABE8.20-m, Cas9 and mock-electroporated samples in order of increasing numbers (Fig. 4i). This pattern was reminiscent of the impact of treatment on edited cell engraftment, as shown in Fig. 3c,h and Extended Data Fig. 2h,o, with variant diversity being a proxy for clonality. However, when we computed the different types of variants and relative proportions of SNV types, we found a similar pattern among ABE8.20-m, Cas9 and mock samples and a slight increase of indels and lower proportions of C>T/G>A transitions and higher proportions of A>C/T>G and G>C/C>G transversions in the BE4max samples, implying a treatment-specific effect on the mutational landscape (Fig. 4j,k). When annotating high- and moderate-impact variants within a selected panel of cancer-associated genes, which may provide a selective advantage to mutant clones, we found few variants in all treated samples, most of which were shared among all treatment groups (Fig. 4l and Supplementary Table 1).
In summary, at the genome-wide level, treatment with BE4max showed alteration of the exome mutational landscape compared to mock or other editing treatments, with an increased load in bulk-analyzed in vitro outgrowth of treated HSPCs and a substantial drop in the oligoclonal resulting graft. Notably, the latter observation was accompanied by a skewed distribution disfavoring the expected deaminase-induced transitions.
Optimized mRNA design improves efficiency and precision of base editing at target sites
To investigate whether the worse performance and lower precision of BE4max could be improved by enhancing expression and lowering innate sensing, we engineered the mRNA constructs with a 5′ cap, better recapitulating the endogenous structure, and included a eukaryotic initiation factor 4G (eIF4G) aptamer in the 5′-untranslated region (5′-UTR; Fig. 5a). Using these optimized mRNAs, we could decrease the effective mRNA dose and reach equivalent or superior editing efficiencies for all editing systems in both bulk and primitive HSPCs (Fig. 5b and Extended Data Fig. 3a), nearly abolishing activation of the IFN response (Fig. 5c and Extended Data Fig. 3b) and lowering the p53 response across different target loci (Fig. 5d and Extended Data Fig. 3c,d). When the optimized editor mRNAs targeting B2M were co-delivered with an mRNA encoding the p53 dominant-negative mutant GSE56, we abrogated p21 (CDKN1A) induction for all editors tested (Fig. 5e), albeit at the cost of slightly reduced efficiency and increased proportion of indels at the target site for BE4max (Extended Data Fig. 3e). By contrast, indels induced at the target site by BE4max were significantly reduced when comparing optimized mRNAs to standard mRNAs (Fig. 5f,g compared to Fig. 1o because experiments were performed side by side with cells from the same HSPC donors). The apparent paradoxical decrease in indels with increased intended base editing by BE4max might be explained by higher coexpression of the UGI domains, resulting in stronger inhibition of BER-initiating factors. Consistent with this hypothesis, the proportion of indels was further lowered when editing at day 3 versus at day 1, when BER-associated genes are less expressed and when using higher doses of mRNA. We obtained similar findings by screening 200 randomly picked HSPC-derived colonies for the occurrence of large deletions encompassing the B2M exon 2 target site (Fig. 5h). There were fewer colonies bearing large deletions from cells edited at day 3 with optimized BE4max mRNA than with standard BE4max mRNA, while Cas9-treated colonies showed, as expected, the opposite behavior (Fig. 5h compared to Fig. 1q because experiments were performed side by side with cells from the same HSPC donors). Similarly, translocations were not detected when using optimized BE4max mRNA, whereas they were again found in Cas9-treated samples (Fig. 5i compared with Fig. 1s because experiments were performed side by side with cells from the same HSPC donors).
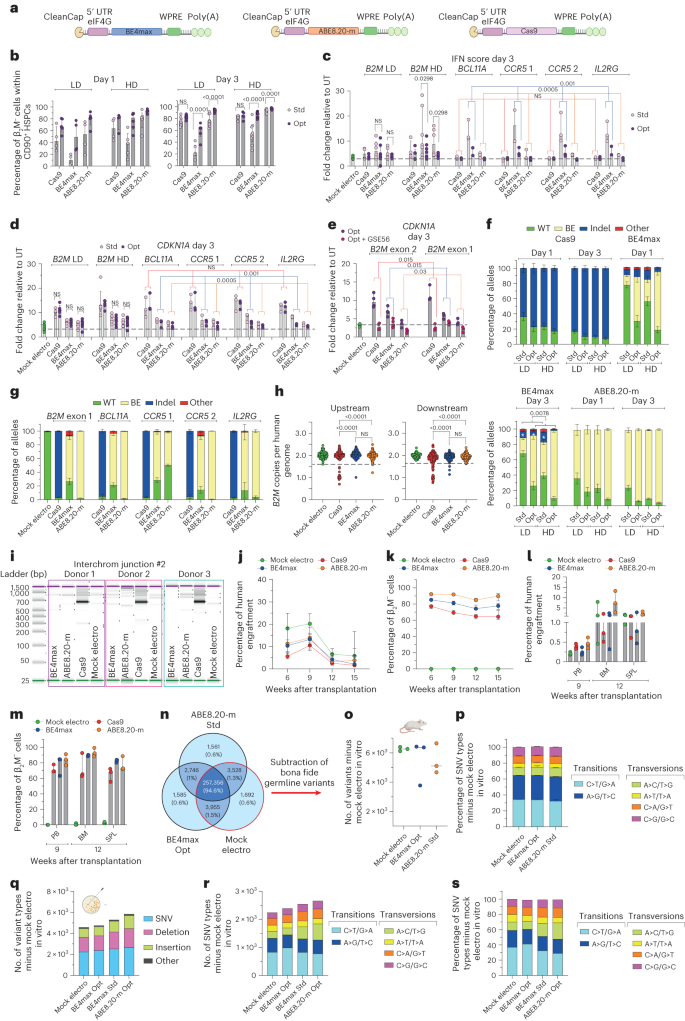
a, Schematic representation of the optimized mRNAs. b, Percentage of β2M−CD34+CD133+CD90+ mPB HSPCs after editing at day 1 (left) or day 3 (right) after thawing and measured by flow cytometry; Std/Opt, standard/optimized; LD, low dose (3.5 μg); HD, high dose (7.5 μg; n = 4, 5, 4, 4, 4 and 5 for low dose day 1; n = 4, 4, 5, 6, 5 and 5 for high dose day 1; n = 8, 9, 6, 6, 8 and 9 for low dose day 3; n = 5, 5, 9, 10, 7 and 7 for high dose day 3). Data are shown as median with IQR and were analyzed by LME model followed by post hoc analysis. c, IFN score defined as the sum of fold change of IRF7, OAS1 and DDX58 expression over untreated samples 24 h after editing at day 3 after thawing (n = 9 for mock-electroporated samples; n = 4, 5, 6, 5, 5 and 5 for B2M low dose; n = 4, 5, 7, 7, 6 and 5 for B2M high dose; n = 3 for BCL11a, CCR5 and IL2RG). Data are shown as median values with IQR. For B2M low dose and high dose, data were analyzed by LME followed by post hoc analysis. For BCL11a, CCR5 and IL2RG, data were analyzed by Friedman test with a Dunn’s multiple comparison on unified samples. d, Fold change of CDKN1A expression over untreated samples 24 h after editing at day 3 after thawing (n = 11 for mock-electroporated samples; n = 5, 5, 6, 6, 6 and 6 for B2M low dose day 3; n = 5, 5, 7, 7, 7 and 7 for B2M high dose day 3; n = 3 for BCL11a, CCR5 and IL2RG). Data are shown as median values with IQR. For B2M low dose and high dose, data were analyzed by LME model followed by post hoc analysis. For BCL11A, CCR5 and IL2RG, data were analyzed by Friedman test with Dunn’s multiple comparison test on unified samples. e, Fold change of CDKN1A expression over untreated samples 24 h after editing at day 3 after thawing with optimized mRNA in the absence or presence of GSE56 (n = 3). Data are shown as median with IQR and were analyzed by Wilcoxon test on the B2M exon 1 and exon 2 unified samples. f, Percentage of B2M exon 2 edited alleles measured by deep sequencing (WT or carrying the described editing outcomes; n = 4). Data are shown as mean ± s.e.m. and were analyzed by Wilcoxon test performed on day 3 ‘Std’ versus ‘Opt’ groups unifying mRNA doses for statistical analysis. g, Percentage of B2M exon 1 (n = 4), BCL11A, CCR5 and IL2RG (n = 3) edited alleles measured by deep sequencing (WT or carrying the described editing outcomes). Data are shown as mean ± s.e.m. h, Copies of B2M sequences per human genome flanking the target site in individual colonies generated by edited mPB HSPCs using optimized mRNAs (n = 105, 186, 184 and 185 for the ‘upstream’ assay; n = 93, 188, 187 and 186 for the ‘downstream’ assay). Dashed lines indicate the lower limit of the confidence interval from mock-electroporated colonies. Data are shown as median with IQR and were analyzed by Fisher’s exact test. i, Images of capillary electropherogram showing amplification of interchromosomal junction 2 shown in Extended Data Fig. 1l after HSPC editing with two gRNAs targeting B2M exon 2 and AAVS1 in three mPB donors. j,k, Percentage of human cell engraftment (j) and percentage of β2M− cells within human grafts (k) in mice transplanted with mPB HSPCs edited at day 3 after thawing with optimized Cas9, BE4max and ABE8.20-m mRNAs at the lowest maximally effective dose (3.5, 7.5 and 3.5 µg, respectively; n = 6). Data are shown as median values with IQR and were analyzed by LME model followed by post hoc analysis. l,m, Percentage of human cell engraftment (l) and β2M− cells within human grafts (m) in secondary recipient mice from j (n = 3). Data are shown as median with range. n, Venn diagrams representing variants shared among in vitro treated samples from Extended Data Fig. 3k. o,p, Number of variants (median; o) and relative proportion of SNV types (mean ± s.e.m; p) in the human xenograft from Extended Data Fig. 3k obtained after subtraction of germline variants. q–s, Number of variants (q), number of SNV types (r) and their relative proportion (s) in the pool of colonies from Extended Data Fig. 3m obtained after subtraction of germline variants. All statistical tests are two tailed. n indicates biologically independent experiments except for h and q–s, in which n indicates independent samples, and j–p, in which n indicates independent animals.
Using the optimized mRNAs at the lowest maximally effective dose allowed reaching >90% stable frequency of edited cells in the mouse xenografts for ABE8.20-m treatment and nearly 80% for BE4max treatment (Fig. 5j,k and Extended Data Fig. 3f–i). These levels of edited cells were also maintained in the human graft of secondary transplants (Fig. 5l,m and Extended Data Fig. 3h,i). Indels at the edited site were low, albeit still detectable, in the human graft of primary recipients for both BEs, confirming that the optimized mRNAs increased not only efficiency but also precision of genetic outcome in long-term repopulating HSPCs (Extended Data Fig. 3j).
Perturbation of the exome mutational landscape emerges after increased expression of BEs
We then evaluated whether the improved expression and activity of BE4max impacted the genome-wide mutational landscape of treated cells and performed the same analyses described above in Fig. 4c (Extended Data Fig. 3k). Different from before, the total number of treatment-associated sequence variants was similar for optimized BE4max, standard ABE8.20-m and mock-electroporated samples (Fig. 5n). Moreover, when we analyzed long-term engrafting clones, subtracting the donors’ germline variants identified in the in vitro analysis, we found similar median numbers of variants among BE4max optimized mRNA-treated and mock-electroporated mice and a slight reduction in ABE8.20-m standard mRNA-treated mice. No differences were observed in the relative proportions of SNV types among all transplanted mice and in the number of variants retrieved in cancer-associated genes (Fig. 5o,p and Extended Data Fig. 3l).
These findings confirm a specific vulnerability of the BE4max editor, likely due to insufficient inhibition of the BER pathway, which results in loss of edited cells and oligoclonal grafts and is alleviated by improved expression of the editor. However, a concern remains that the impact of BE4max on the genomic mutational landscape that emerged in the prior condition might now have escaped detection because of limited sensitivity in the context of more robust clonal abundance in the sample. We thus performed an orthogonal analysis on samples comprising a small, known and evenly distributed number of edited clones (Extended Data Fig. 3m). We sequenced the exomes of pools of six edit-bearing colonies outgrown from single-donor HSPCs treated with each different editor and expression construct and focused our bioinformatic analysis on mutations with a variant allele frequency compatible with the rate of in vitro accrual of mutations. Remarkably, this analysis confirmed previous findings of a slight increase in, but evident skewing of, SNV types toward transversions for standard BE4max samples compared to mock samples, which was alleviated by the improved expression construct (Fig. 5q–s). Notably, in the latter optimized conditions, a trend toward increased proportions of the expected C>T/G>A transitions emerged over mock-electroporated samples. However, cells treated with optimized ABE8.20-m construct showed an even higher increase in variants, with skewed proportions toward transversions, cautioning that increased and/or prolonged activity of this type of editor might also increase adverse effects across the genome.
Efficient prime editing in human HSPCs does not escape DNA DSBs and cellular sensing
To broaden our investigation of nickase-based gene editors, we then included prime editing in our study. We first designed a panel of pegRNAs spanning B2M to induce its KO. Each pegRNA was also paired with a gRNA to explore a PE3 setup, generating a nick on both DNA strands (Fig. 6a). No B2M modification was observed in K-562 cells for all pegRNAs tested except for pegRNA5, which induced 20% and 90% modified alleles when used without or with the cognate gRNA, respectively (Fig. 6b). We then tested the selected PE3 setup in mPB-derived HSPCs from six independent healthy donors and treated cells after 3 d of culture when expression of most genes belonging to the DNA mismatch repair (MMR) pathway, which may antagonize prime editing, becomes lower24,31 (Extended Data Fig. 4a,b). B2M-KO cells were 30% in the bulk culture and 35% in the most primitive compartment (Fig. 6c and Extended Data Fig. 4c) without detectable changes in composition of progenitor subsets (Fig. 6d). Molecular analysis revealed up to 60% modified B2M alleles, without detectable deletions spanning from one to the other nicking site by PCR (Extended Data Fig. 4d,e). Deep-sequencing analysis of the B2M target site showed an average 40% precise prime editing outcome and 4.5% with additional insertion of the first bases of the pegRNA scaffold or small deletions at either nicking site (Fig. 6e and Extended Data Fig. 4f).
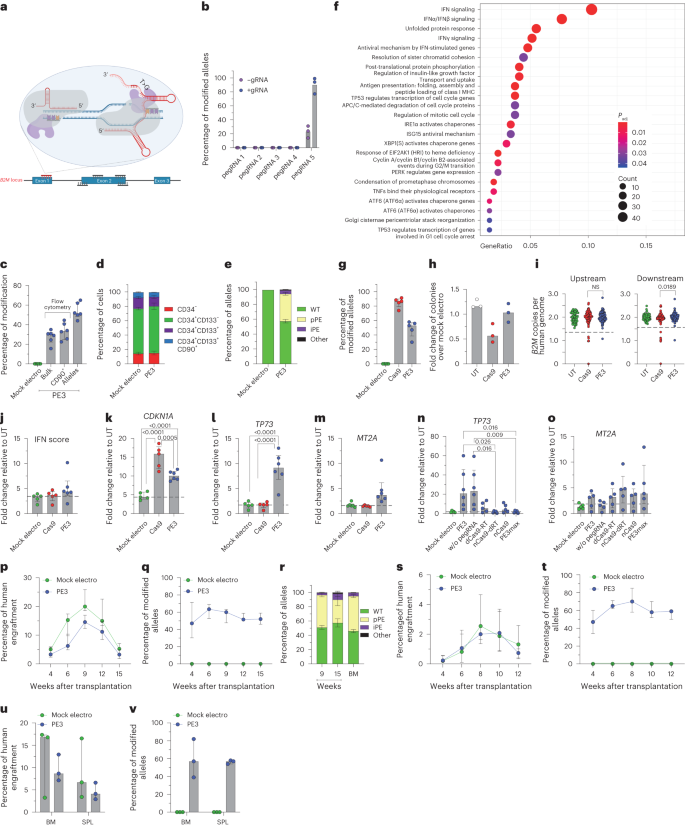
a, Schematic representation of the B2M prime editing screening. The selected pegRNA and gRNA are represented in red. b, Percentage of B2M prime-edited alleles in K-562 cells measured by Sanger sequencing 9 d after the editing procedure (n = 3). Data are shown as median values. c, Flow cytometry (bulk and CD90+) and molecular analysis of B2M modification 7 d after prime editing in human mPB HSPCs (n = 6). Data are shown as median values with IQR. d, Proportion of cell subpopulations within mPB HSPCs from experiments in c (n = 6). Data are shown as mean ± s.e.m. e, Percentage of B2M alleles measured by deep sequencing (WT or carrying precise prime editing (pPE), imprecise prime editing (iPE) or other modifications in mPB HSPCs; n = 6). Data are shown as mean ± s.e.m. f, Dot plot of adjusted P values of enriched categories on upregulated (FDR < 0.05 and log (fold change) > 0) genes for PE3 versus mock-electroporated HSPCs. Data were analyzed by enrichment test; Padj, adjusted P value; MHC, major histocompatibility complex. g, Percentage of B2M Cas9- or PE3-edited alleles 7 d after treatment of mPB HSPCs (n = 5). Data are shown as median values with IQR and were analyzed by Mann–Whitney test. h, Fold change in the number of colonies generated by mPB HPSCs over mock-electroporated cells (n = 3). Data are shown as median values. i, Copies of B2M sequences per human genome flanking the target site in individual colonies generated by edited mPB HSPCs (n = 70, 137 and 137 for the ‘upstream’ assay; n = 70, 137 and 139 for the ‘downstream’ assay). Dashed lines indicate the lower limit of the confidence interval from mock-electroporated colonies. Data are shown as median values with IQR and were analyzed by Fisher’s exact test. j, IFN score defined as the sum of fold change of IRF7, OAS1 and DDX58 expression over untreated 24 h after editing (n = 5, 5 and 6). Data are shown as median with IQR and were analyzed by LME followed by post hoc analysis. k–o, Fold change in expression of CDKN1A (n = 5, 5 and 6; k), TP73 (n = 5, 5 and 6; n = 5, 6, 6, 5, 5, 5 and 5; l) and MT2A (n = 5, 5 and 6; n = 5, 6, 6, 5, 5, 5 and 5; m) over that in untreated samples 24 h after editing (n = 5, 5 and 6). Data are shown as median values with IQR and were analyzed by LME model followed by post hoc analysis; dRT, catalytically inactive (dead) RT. p,q, Percentage of human cell engraftment (LME model followed by post hoc analysis; p) and percentage of modified B2M alleles within human grafts (o) in mice transplanted with mPB HSPCs edited at B2M following PE3 or mock electroporation (n = 5 and 6). Data are shown as median with IQR. r, Percentage of B2M alleles measured by deep sequencing (WT or carrying precise prime editing, imprecise prime editing or other modifications in PB and BM of mice from p; n = 6). Data are shown as mean ± s.e.m. s,t, Percentage of human cell engraftment (s) and percentage of modified B2M alleles within human grafts (t) in secondary recipient mice (n = 3). Data are shown as median values with ranges. u,v, Percentage of human cell engraftment (u) and modified B2M alleles (v) in BM and SPL of secondary recipient mice from s (n = 3). Data are shown as median values with ranges. All statistical tests are two tailed. n indicates biologically independent experiments except for i, in which n indicates independent samples, and p–v, in which n indicates independent animals.
Transcriptional analysis performed 24 h after PE3 treatment showed significant upregulation of genes related to IFN signaling (IFI6 and ISG15), p53 activation (CDKN1A and MDM2) and unfolded protein response (HSPA5 and ATF3; Extended Data Fig. 4g). Enrichment analysis confirmed activation of these pathways in PE3-treated cells compared to mock-electroporated HSPCs (Fig. 6f). To stringently compare Cas9 and PE3 side by side, we combined Cas9 nuclease with B2M exon 1 gRNA that contains the spacer sequence of pegRNA5 as the targeting region (Extended Data Fig. 4h) and reached 80% and 50% allele modification, respectively, by the two systems (Fig. 6g). Cas9-treated, but not PE3-treated, HSPCs showed a trend toward lower clonogenic capacity than mock-electroporated cells, indicating a stronger impact of Cas9 than PE3 on HSPCs (Fig. 6h). Screening of around 140 randomly picked single colonies revealed the occurrence of large deletions after both treatments, although to a lower extent with PE3 than with Cas9 (Fig. 6i and Extended Data Fig. 4i). We next interrogated PE3- and Cas9-edited HSPCs for activation of selected IFN response and p53 pathway genes and found a slight induction of the former pathway genes in PE3 samples and an upregulation of the latter pathway genes in both treatments to a lower extent in PE3-edited samples than in Cas9-edited samples, consistent with the above findings (Fig. 6j,k and Extended Data Fig. 4j). We found selective activation of the proapoptotic isoform of TP73 after prime editing, which was completely absent when performing either Cas9 or base editing (Fig. 6l and Extended Data Fig. 4k,l). Moreover, we found a mild but specific activation of MT2A in PE3-edited samples, supporting the activation of apoptotic responses (Fig. 6m). Overexpression of TP73 by PE-edited samples occurred in the presence and absence of pegRNA in all six mPB HSPC donors tested (Fig. 6n) but was absent for a catalytically inactive RT fused with the nickase. However, a catalytically active RT fused with dCas9 failed to induce a similar response, showing that RT activity is necessary but not sufficient to induce proapoptotic TP73 transcription. Together, these results suggest that TP73 induction requires both RT activity and a concomitant nick at its DNA binding site, whether mediated by the gRNA or pegRNA. Notably, the use of the PE3max strategy, which improved prime editing efficiency by approximately 1.5-fold (Extended Data Fig. 4m), prevented induction of TP73 but not MT2A (Fig. 6o).
Prime-edited HSPCs engrafted and persisted long term in xenotransplanted mice, maintaining >50% editing efficiency in PB and hematopoietic organs (Fig. 6p,q and Extended Data Fig. 4n,o) with no skewing of lineage compositions (Extended Data Fig. 4p,q). The graft size of PE3-treated cells was reduced compared to mock-electroporated cells, in particular at early times, conceivably due to a detrimental impact of the cellular responses described above on short-term repopulating progenitors. Deep-sequencing analysis of the B2M target site on PB and BM cells revealed an average of 42% precise and 5% imprecise prime editing outcomes (Fig. 6r). Prime-edited HSPCs were able to engraft in secondary recipients, maintaining >50% efficiency in PB and hematopoietic organs (Fig. 6s–v and Extended Data Fig. 4p,q).
These data show that prime editing may reach substantial efficiency in long-term repopulating HSPCs and thus potentially broaden applications of genome editing to include transversion and other changes in the target sequence, with the current caveat of selecting an effective pegRNA. As also shown for BE, PE can still induce DNA DSBs and deletions at the target site, albeit to a lower extent than nuclease-based editing, and does not escape cellular sensing of its unique machinery comprising a nickase and RT.
[ad_2]
Source link


